Nginx log monitoring with Elasticsearch Ecosystem
Nov 1, 2020
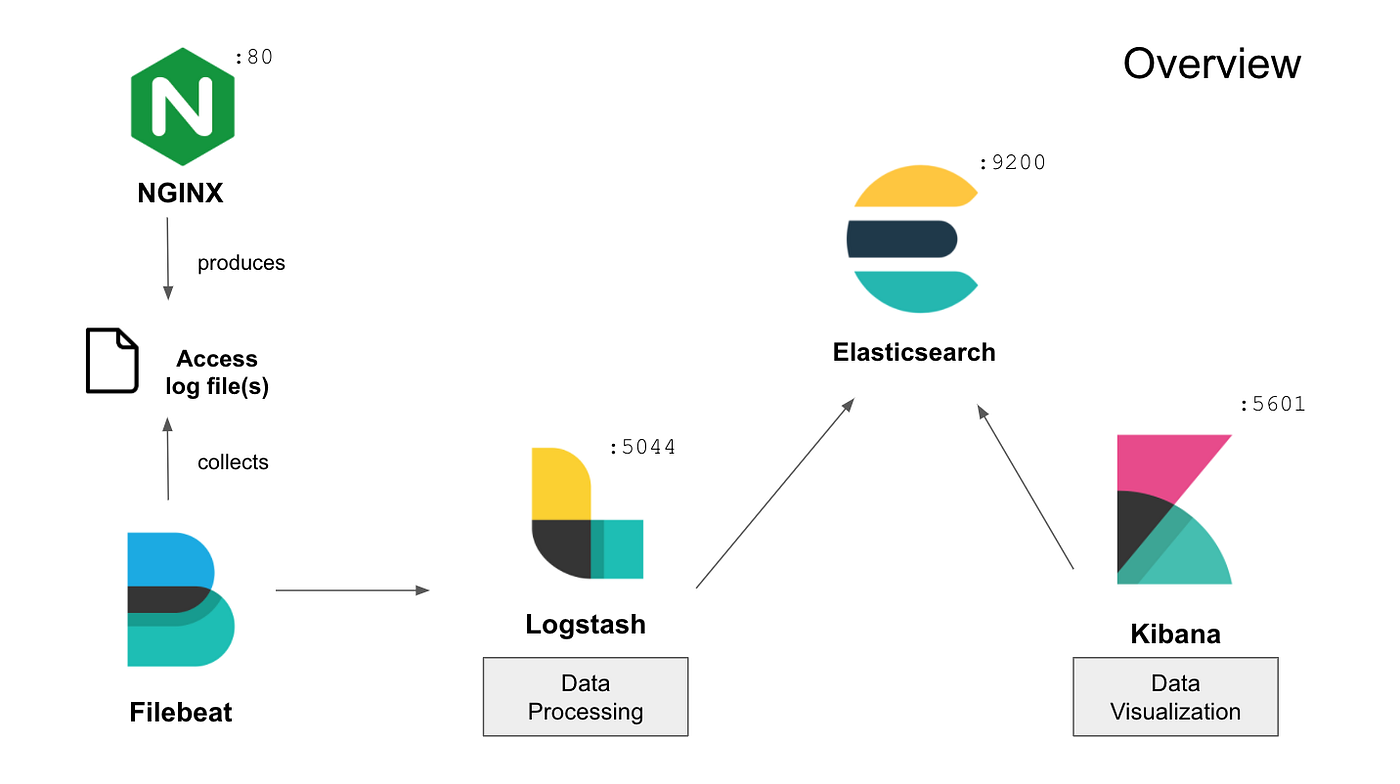
Nginx
1. Install and run nginx as root
sudo apt-get install nginx2. Give read permissions to NGINX access logs for hadoop user (Public/Others)
sudo chmod 644 /var/log/nginx/access.logFrom now on, switch to normal user (hadoop)
Elasticsearch
1. Install Elasticsearch at /home/hadoop/elasticsearch
1.1 Download Elasticsearch from official website using wget
wget https://artifacts.elastic.co/downloads/elasticsearch/elasticsearch-5.6.12.tar.gz1.2 Extract file
tar xvf elasticsearch-5.6.12.tar.gz1.3 Rename Elasticsearch directory
mv elasticsearch-5.6.12 elasticsearch2. Start Elasticsearch
/home/hadoop/elasticsearch/bin/elasticsearchFilebeat
1. Install Filebeat at /home/hadoop/filebeat and enter its directory
cd /home/hadoop/filebeat2. Create fb-nginx.yml file to configure Filebeat
- Set NGINX access log (default at /var/log/nginx/access.log) as Filebeat log input
- Set Logstash port as an output
3. Change permissions for fb-nginx.yml file
chmod go-w /home/hadoop/filebeat/fb-nginx.yml4. Start Filebeat with the configuration file
./filebeat -e -c fb-nginx.yml -d “publish”Logstash
1. Install Logstash at /home/hadoop/logstash and enter its directory
cd /home/hadoop/logstash2. Create nginx.conf file to configure Logstash
- Use grok filter to parse and structure a log message line into fields, then remove original full log message line
- Use … filter…
- …
3. Start Logstash with the configuration file
./bin/logstash -f nginx.conf — config.reload.automaticKibana
1. Install Kibana at /home/hadoop/kibana and enter its directory
cd /home/hadoop/kibana2. Set these directives on config/kibana.yml:
- server.host: “YOUR_IP_HERE”
or server.host: “127.0.0.1” for local only
or server.host: “0.0.0.0” for all IP addresses - elasticsearch.url: “http://localhost:9200"
3. Start Kibana
bin/kibana